Discover
Updated 2.10
Discover is a tool for exploring your data in OpenSearch Dashboards. You can use Discover to visually represent your data on a dashboard and provide a high-level view of key metrics.
![]() The legacy Discover tool will be deprecated in OpenSearch 2.11. The updated Discover tool provides new features and enhancements that make the data exploration experience in OpenSearch Dashboards more intuitive and user friendly. To use the updated tool now, install the latest version of OpenSearch Dashboards or try out these features using OpenSearch Playground.
The legacy Discover tool will be deprecated in OpenSearch 2.11. The updated Discover tool provides new features and enhancements that make the data exploration experience in OpenSearch Dashboards more intuitive and user friendly. To use the updated tool now, install the latest version of OpenSearch Dashboards or try out these features using OpenSearch Playground.
In this tutorial, you’ll learn about using Discover to:
- Add data.
- Interpret and visualize data.
- Share the data findings.
- Set alerts.
Prerequisites
The following are prerequisites for using Discover:
- Install OpenSearch Dashboards 2.10 or later.
- Add OpenSearch sample data or import your own data into OpenSearch.
- Have a foundational understanding of OpenSearch documents and indexes.
Import data
You must add data to OpenSearch before you can start analyzing it. This tutorial uses sample data. To add the sample data, follow these steps:
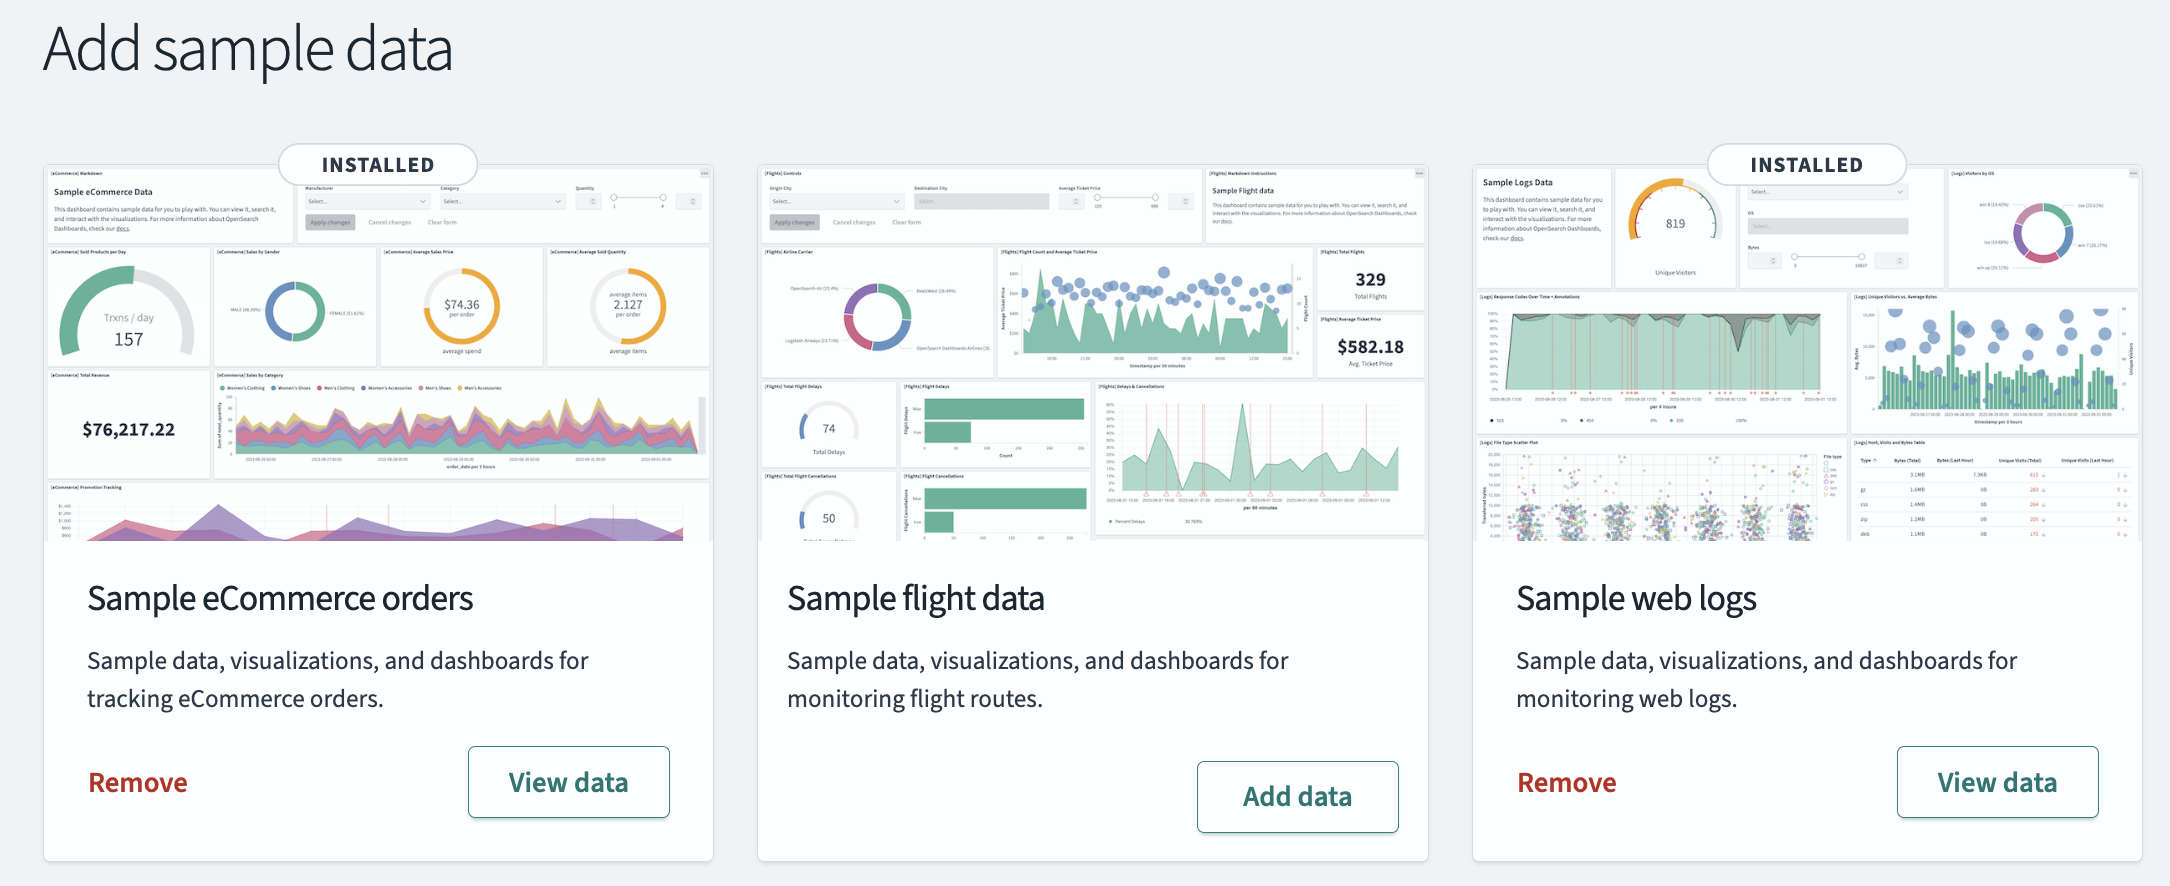
- On the OpenSearch Dashboards home page, choose Add sample data.
- Choose the desired sample data and select the Add data button. An example is shown in the following image.
![]() Note
Note
To learn about importing your own data, see Managing indexes.
Define your search
To define a search, follow these steps:
- On the OpenSearch Dashboards navigation menu, select Discover.
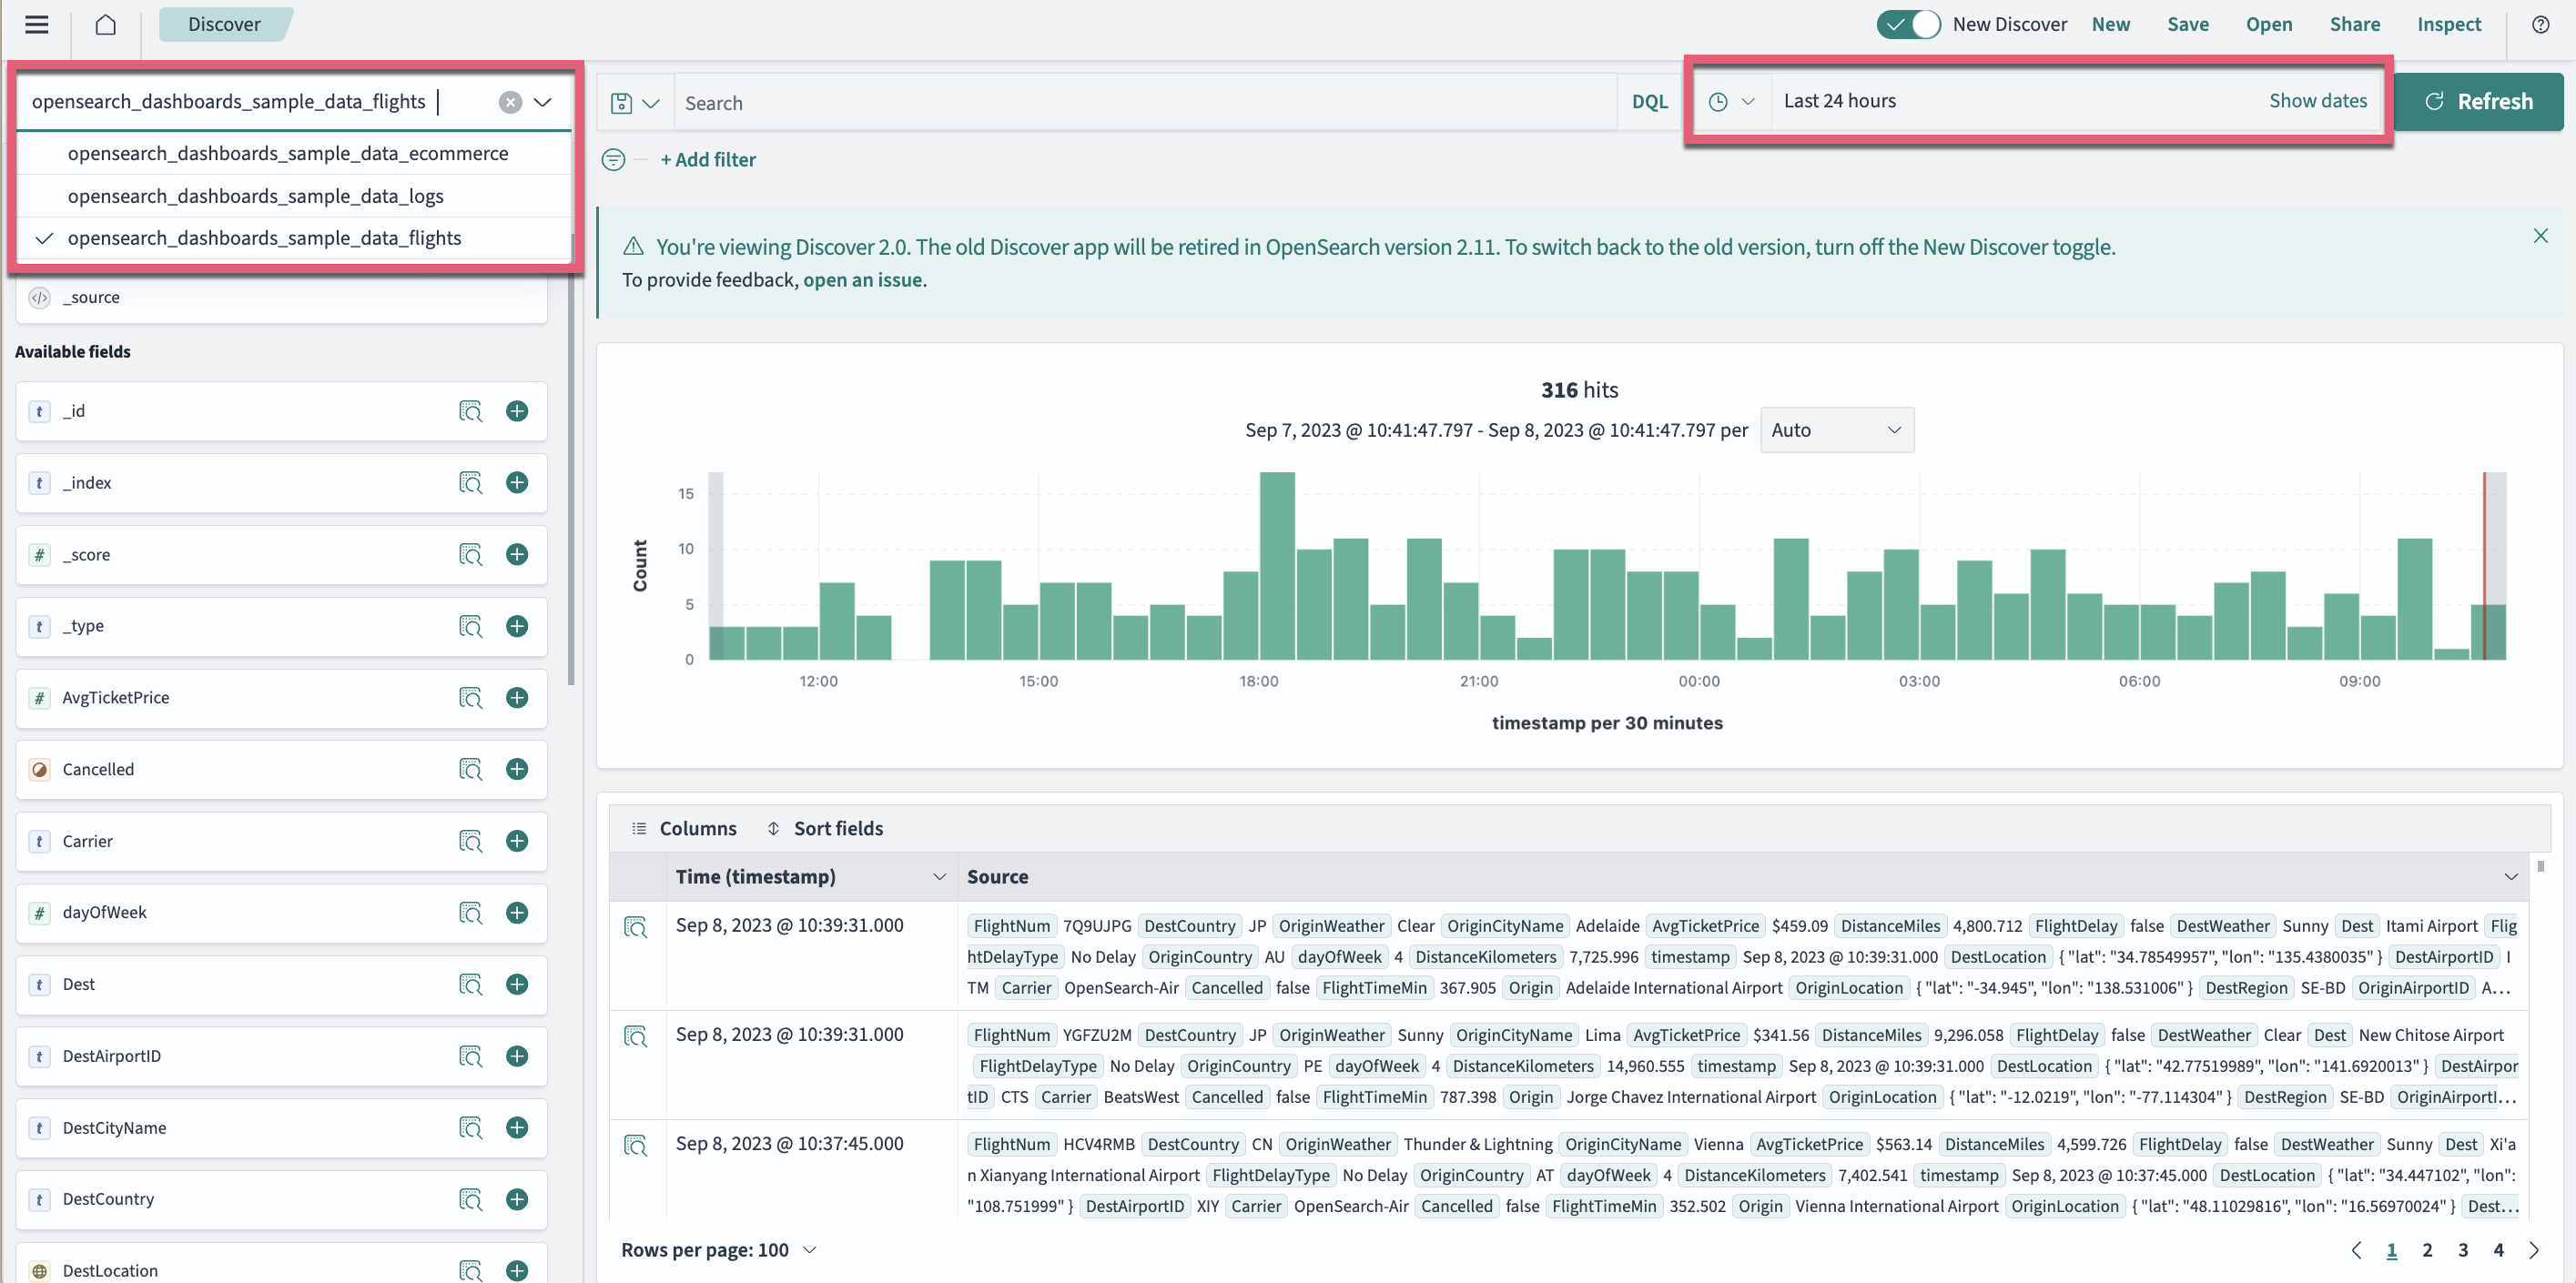
- Choose the data you want to work with. In this case, choose
opensearch_dashboards_sample_data_flightsfrom the upper-left dropdown menu. - Select the calendar icon (
 ) or clock icon (
 ) to change the time range of your search. An example is shown in the following image.
Add data fields and get data details
The document table contains document data. Each row represents a single document, and each column contains a different document field representing metrics such as flight destination, average ticket price, and flight delay. You can add, delete, or modify data fields in a document table as needed to meet your data analysis requirements.
To add or delete fields in a document table, follow these steps:
- View the data fields listed under Available fields and select the plus icon (
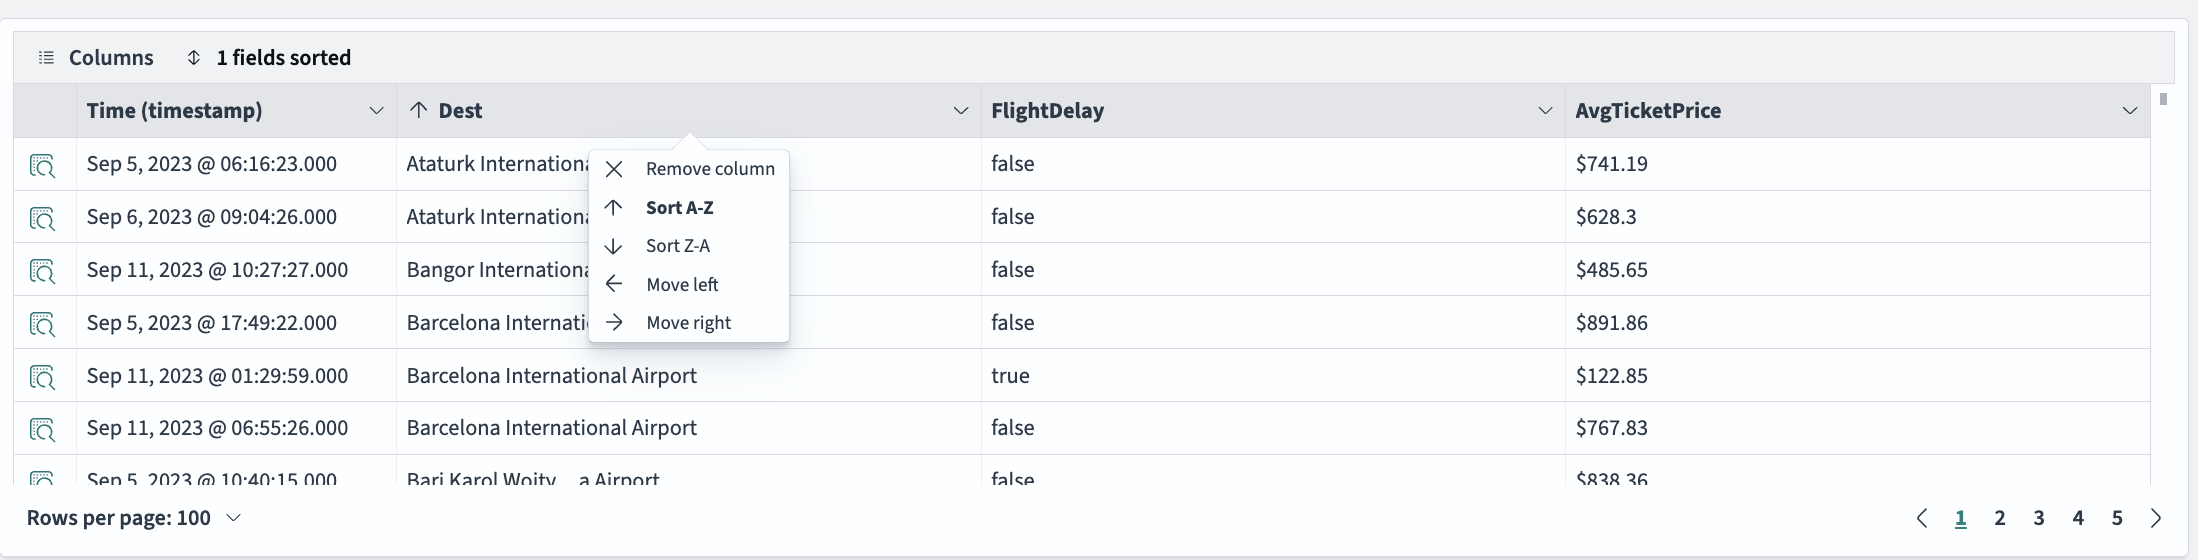
 ) to add the desired fields to the document table. The field will be automatically added to both Selected fields and the document table. For this example, choose the fields
 Carrier,AvgTicketPrice, andDest. - To arrange or sort the columns, select the column header containing the field name and select the desired action. An example is shown in the following image.
You can view individual or multiple fields in the document table. To gather information about the data in the document table, follow these steps:
- Choose the inspect icon (
 ) to open the Document Details window.
 - Review the data details. You can switch between the Table and JSON tabs to view the data in your preferred format.
- Select View surrounding documents to view data for other log entries either preceding or following your current document or select View single document to view a particular log entry.
Search your data
You can use the search toolbar or enter a DQL query using the DevTools console to search data. While the search toolbar is best for basic queries, such as field name queries, DQL is best for complex queries, such as term, string, Boolean, date, range, or nested queries. DQL provides suggestions for fields and operators as you type, helping you build structured queries.
To search data, follow these steps:
- Enter a simple query in the DQL search bar. For example, enter
FlightDelay:true, which searches for delayed flights. - Select the Update button to the right of the search bar.
- Enter a more complex query in the DQL search bar, and then select Update. For example, enter
FlightDelay:true AND FlightDelayMin >= 60, which searches the data for flights delayed by 60 minutes or more.
Filter your data
Filters allow you to narrow the results of a query by specifying certain criteria. You can filter by field, value, or range. The Add filter pop-up suggests the available fields and operators.
To filter your data, follow these steps:
- Under the DQL search bar, choose Add filter.
- Select the desired options from the Field, Operator, and Value dropdown lists. For example, select
Cancelled,is, andtrue. - Choose Save.
- To remove the filter, choose the cross icon (
 ) next to the filter name.
 - Add more filters to further explore the data.
Save a search
To save your search, including the query text, filters, and current data view, follow these steps:
- Select Save in the upper-right corner.
- Give the search a title, and then choose Save.
- Select Open to access the saved search.
Create visual representations of your findings
To create visualizations of your data findings, follow these steps:
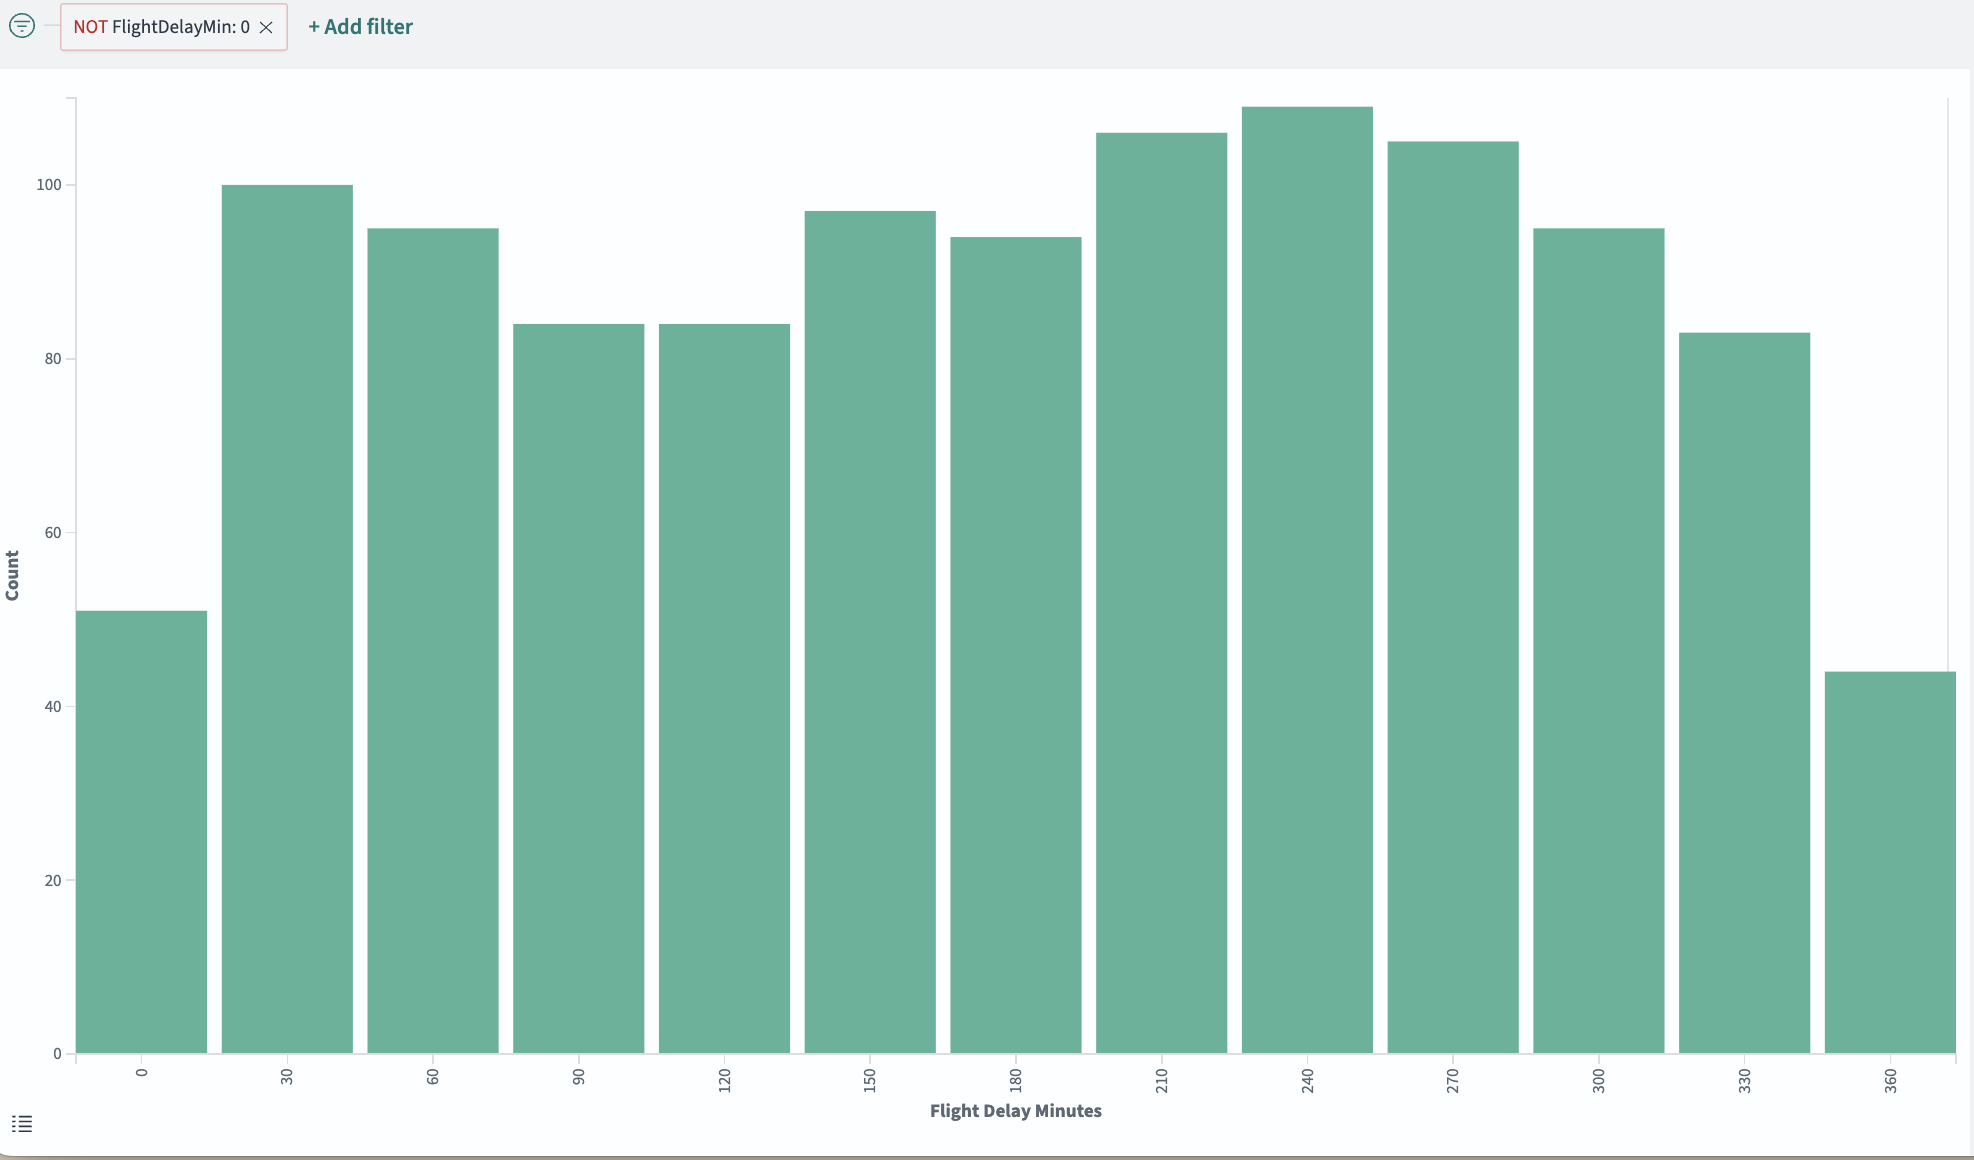
- Select the inspect icon () next to the field you want to visualize. An example is shown in the following image.
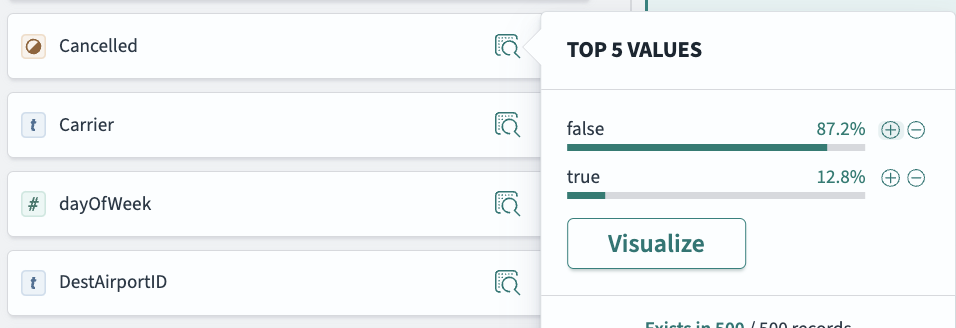
- Select the Visualize button. A visualization is displayed. An example is shown in the following image.
Set alerts
You can set alerts to notify you when your data changes beyond the thresholds you define. To learn more about using Discover to create and manage alerts, see Alerting dashboards and visualizations.